Company Update | Banking
December 1, 2016
Federal Bank
BUY
CMP
`71
Target Price
`85
Loan growth to remain decent, albeit lower pace seen in the last two quarters: In
Investment Period
12 Months
Q1FY17, the bank reported 19% loan growth, which further accelerated to 27%
in Q2FY17, backed by 47% jump in corporate loan book. Retail loans also were
Stock Info
strong. Gold loan, which had been under pressure and also saw degrowth in
previous quarters, saw a comeback thus contributing to the growth. While the
Sector
Banking
process of demonetization is likely to have an impact and loan growth might
Market Cap (` cr)
12,156
slow down in Q3 & Q4FY17, we expect Federal Bank to bounce back to 17-18%
Beta
1.3
YoY loan growth trajectory in FY18.
52 Week High / Low
86 / 41
Deposit growth will get a further boost, CASA to remain high: Deposit growth for
Avg. Daily Volume
515,000
the banking industry witnessed some improvement in Q2FY17. Federal bank
reported a jump of 17% in deposit base on top of 12.5% growth in Q1FY17. We
Face Value (`)
2
have already seen rush in bank deposits amid the demonetization move, this will
BSE Sensex
25,850
further accelerate the growth in deposit base. Though interest rates will further
Nifty
7,976
come down, the banking industry including Federal Bank will continue to see
surge in deposits in the months to come.
Reuters Code
FED.BO
Asset quality stress has started stabilizing: High slippages and resultant credit
Bloomberg Code
FB@IN
cost had dented the profitability of Federal Bank in FY16. However in the last two
quarters, the slippages have been under control. Q2FY17 slippages of
`266cr
was the lowest in the last five quarters. Total stressed asset at
4.8%
Shareholding Pattern (%)
(NNPAs1.61% + Restructured 3.2%) is not alarming. While it’s too early to say
Promoters
0.0
that the trouble is over, the initial signs are encouraging. Further quantifying the
impact of demonetization is a challenging task, but it is a fact that SMEs do have
MF/ Banks / Indian Fis
32.8
large cash transactions either for input or for finished goods. While there could
FII/ NRI/ OCBs
43.7
be some incremental pressure on asset quality in the near term, the relatively
improving corporate loan book of Federal Bank gives us comfort.
Indian Public / Others
23.5
High credit cost dented the return ratios so far, expect RoE to bounce back in
FY18: Higher slippages dented the RoE both due to reversal of interest and rise
Abs. (%)
3 m
1 yr
3 yr
in provisions. However, the lower slippages expected in the coming years would
normalize the return ratios and we expect RoE to scale back to 10% trajectory by
Sensex
(6.9)
0.9
26.4
FY18. Further, accelerated loan growth should also support higher fees income
Federal Bank
1.2
19.3
74.4
and consequently RoE.
Outlook and valuation: Federal Bank has already recognized large part of the
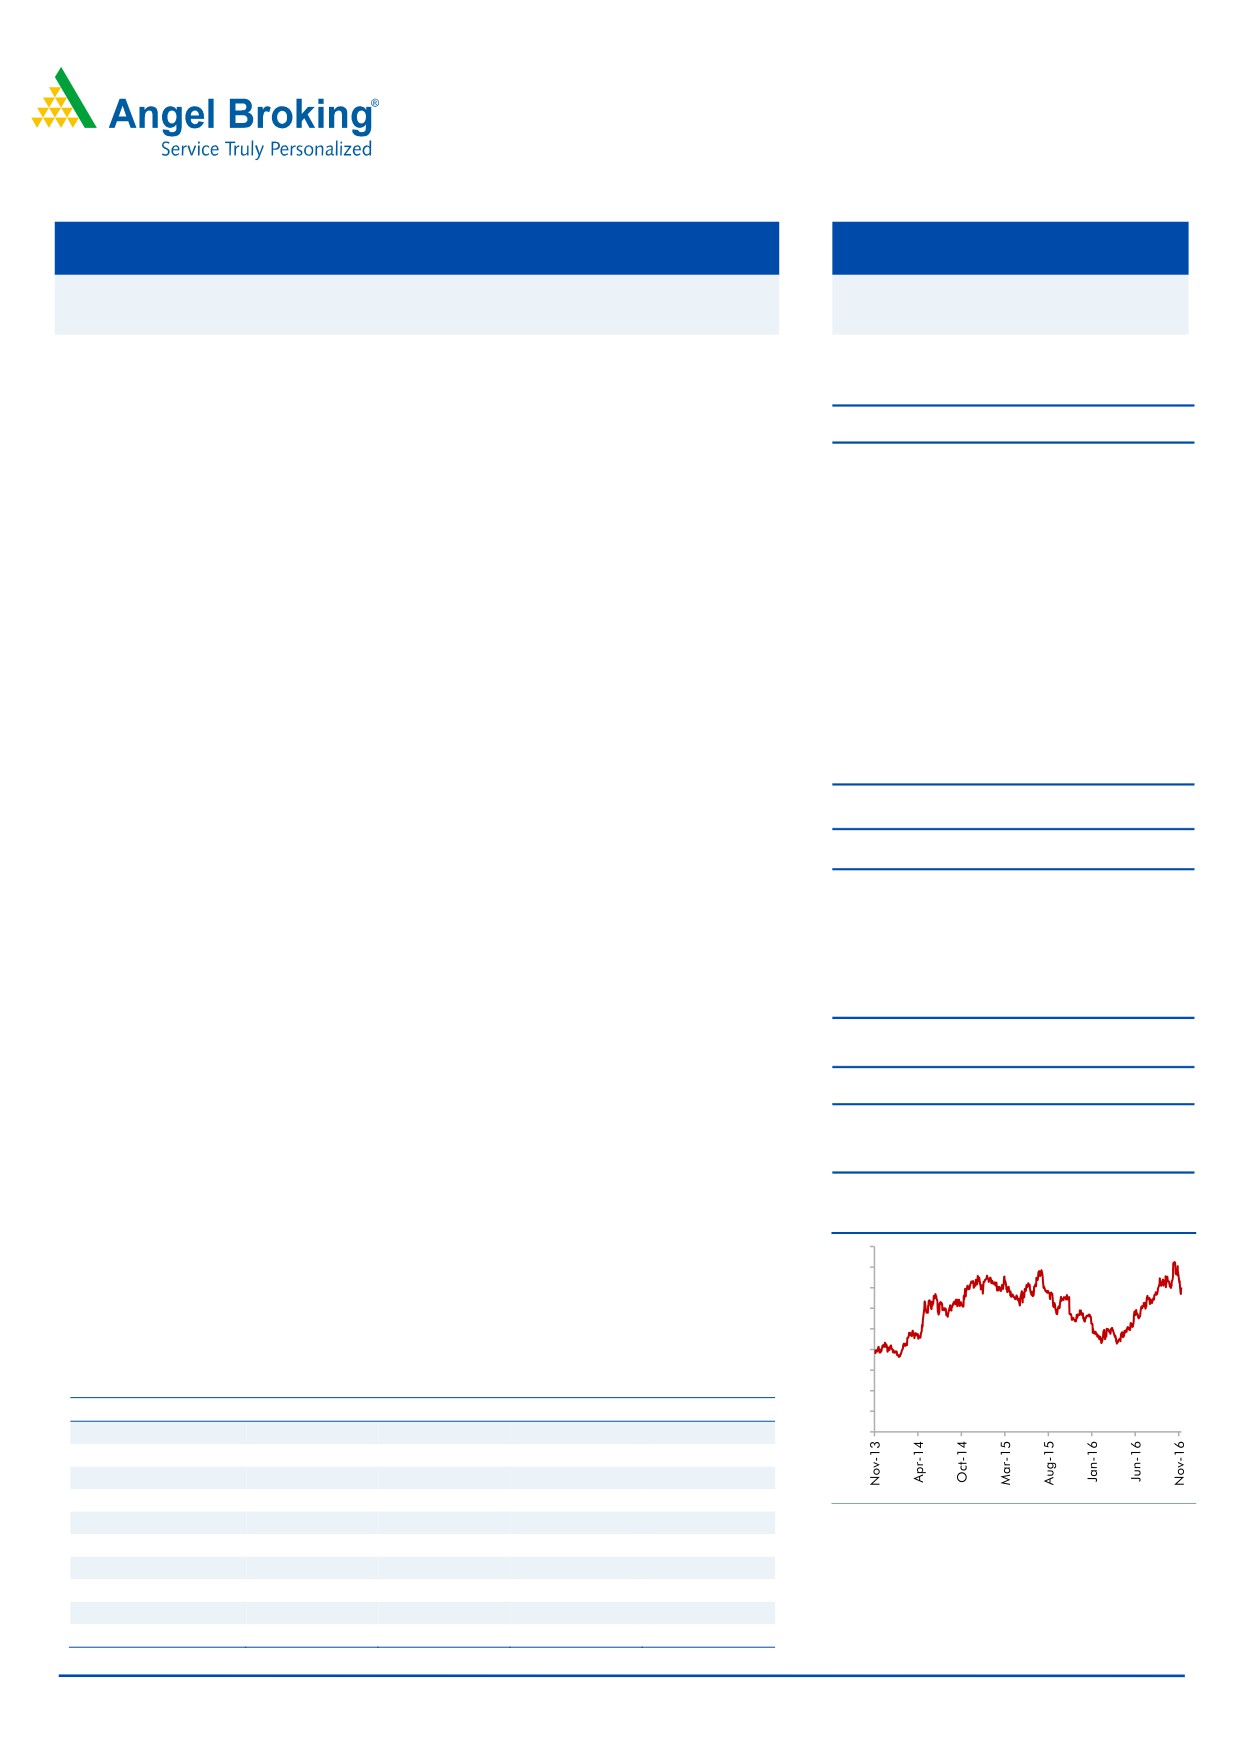
3-year price chart
troubled assets as NPAs. While there could be incrementally some degree of
90
stress on the SME book, we believe gradually there should be overall
80
70
improvement in the asset quality backed by the corporate loan book. At the
60
CMP, the stock is trading at 1.4x it FY18 Adj BV. We upgrade the stock to BUY
50
with a target price of `85.
40
30
Key financials (Standalone)
20
Y/E March (` cr)
FY2015
FY2016
FY2017E
FY2018E
10
NII
2,380
2,504
2,899
3,292
-
% chg
6.8
5.2
15.8
13.6
Net profit
1,006
476
746
958
% chg
19.9
(52.7)
56.8
28.4
Source: Company, Angel Research
NIM (%)
3.0
2.9
3.0
3.0
EPS (`)
11.7
2.8
4.3
5.6
P/E (x)
6.0
25.3
16.1
12.6
P/ABV (x)
0.8
1.7
1.5
1.4
Siddharth Purohit
RoA (%)
1.3
0.5
0.8
0.9
022 - 3935 7800 Ext: 6828
RoE (%)
13.0
5.9
8.5
10.1
Source: Company, Angel Research; Note: CMP as of November 30, 2016
Please refer to important disclosures at the end of this report
1
Federal Bank | Company Update
Loan growth to remain decent, albeit lower pace seen in
the last two quarters;
Federal Bank has reported decent loan growth over the last two years. In Q1 and
Q2 of FY17, the bank has seen further acceleration in the loan growth by 19% and
27%, respectively. The phenomenally high growth in Q2FY17 was backed by 47%
jump in loan book from the corporate loan book. Historically, SME has been a
growth driver for Federal Bank and accounts for ~25% of the loan book.
Corporate loans have also been witnessing strong growth in the last few quarters
and now account for 35% of the book compared to 30% in Q1FY16.
While it is difficult to quantify the effect of demonetization on banking space, it is
fair to assume a slowdown in the SME and Corporate segment. The smaller and
micro enterprises depend on cash to large extent both for their input and selling
their final output, and hence there could be a moderation in the loan growth in the
coming two quarters. However, the interest rate regime in India is likely to remain
low for many quarters to come and this should help better credit growth after a
pause that we are likely to see in the next two quarters.
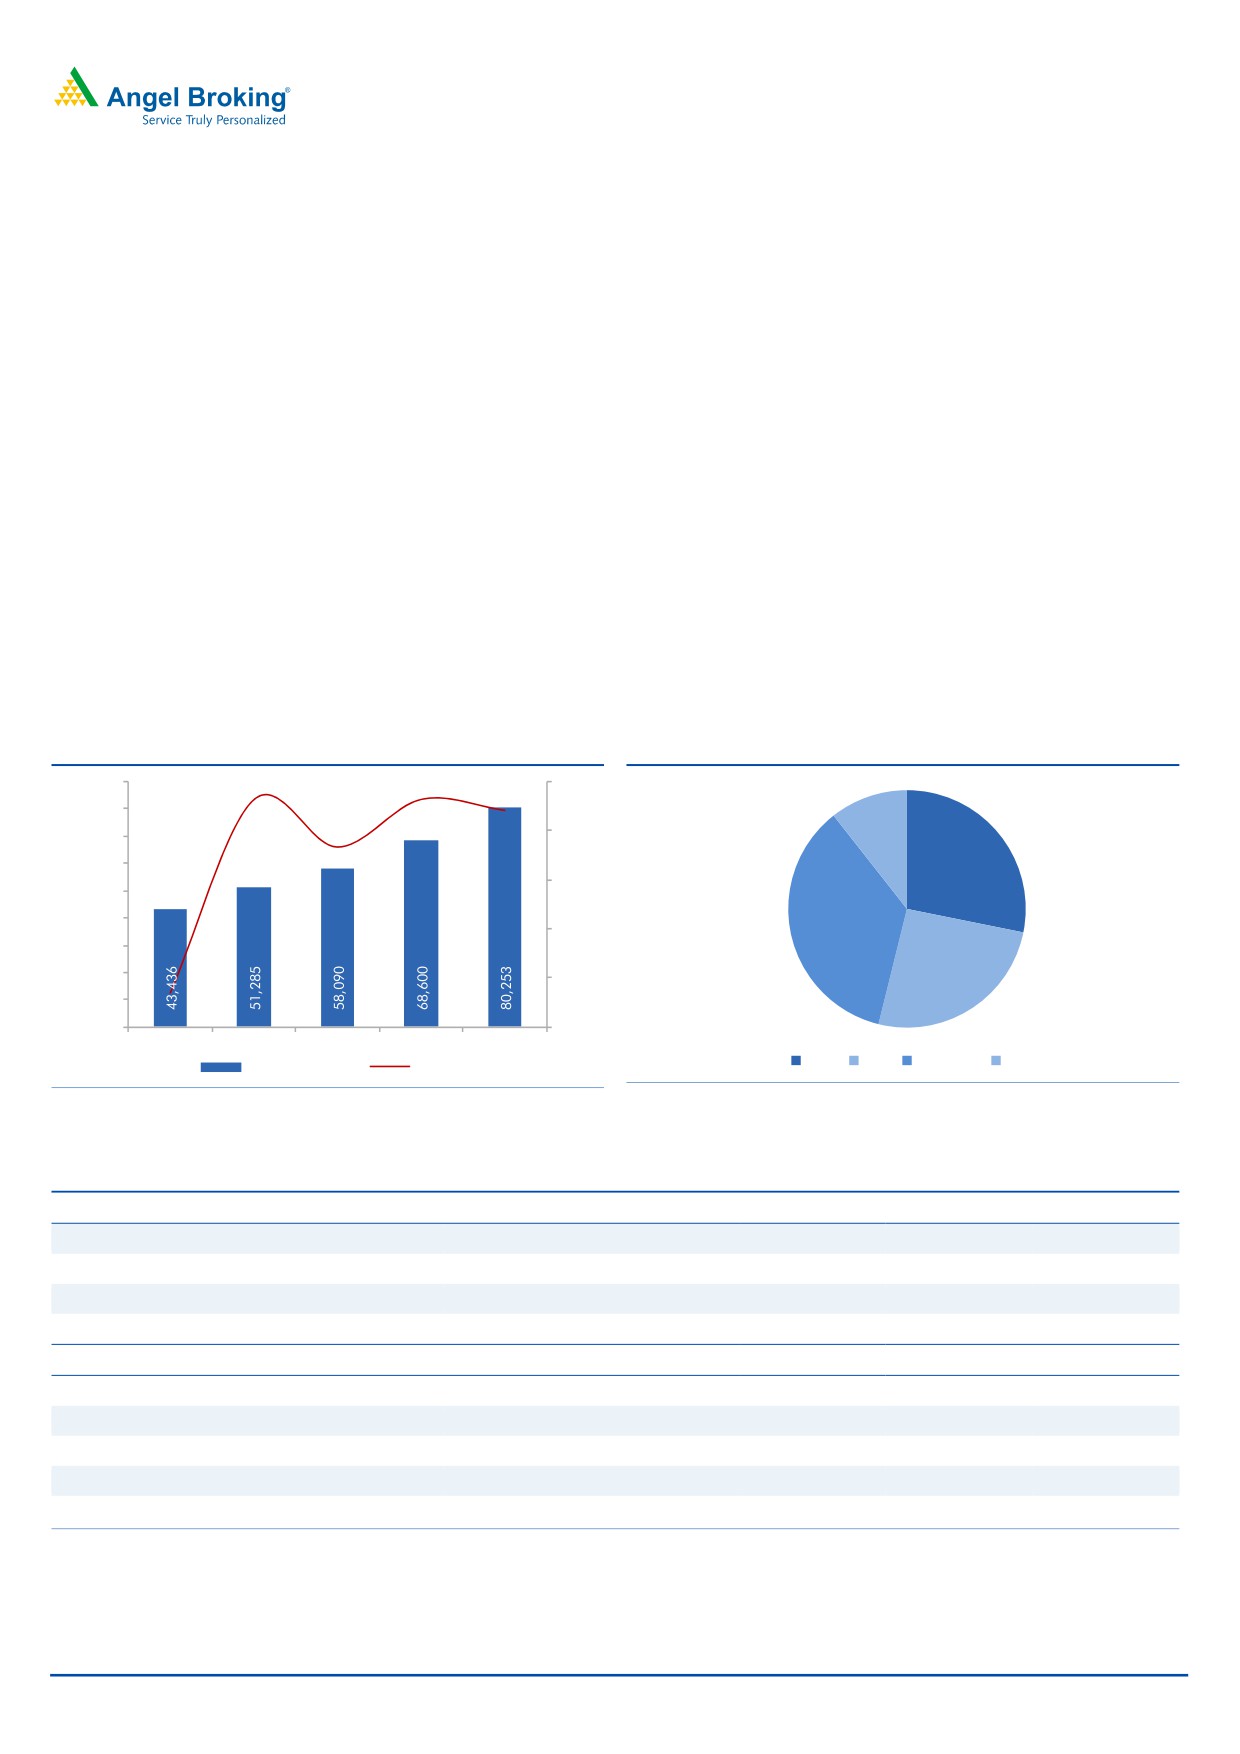
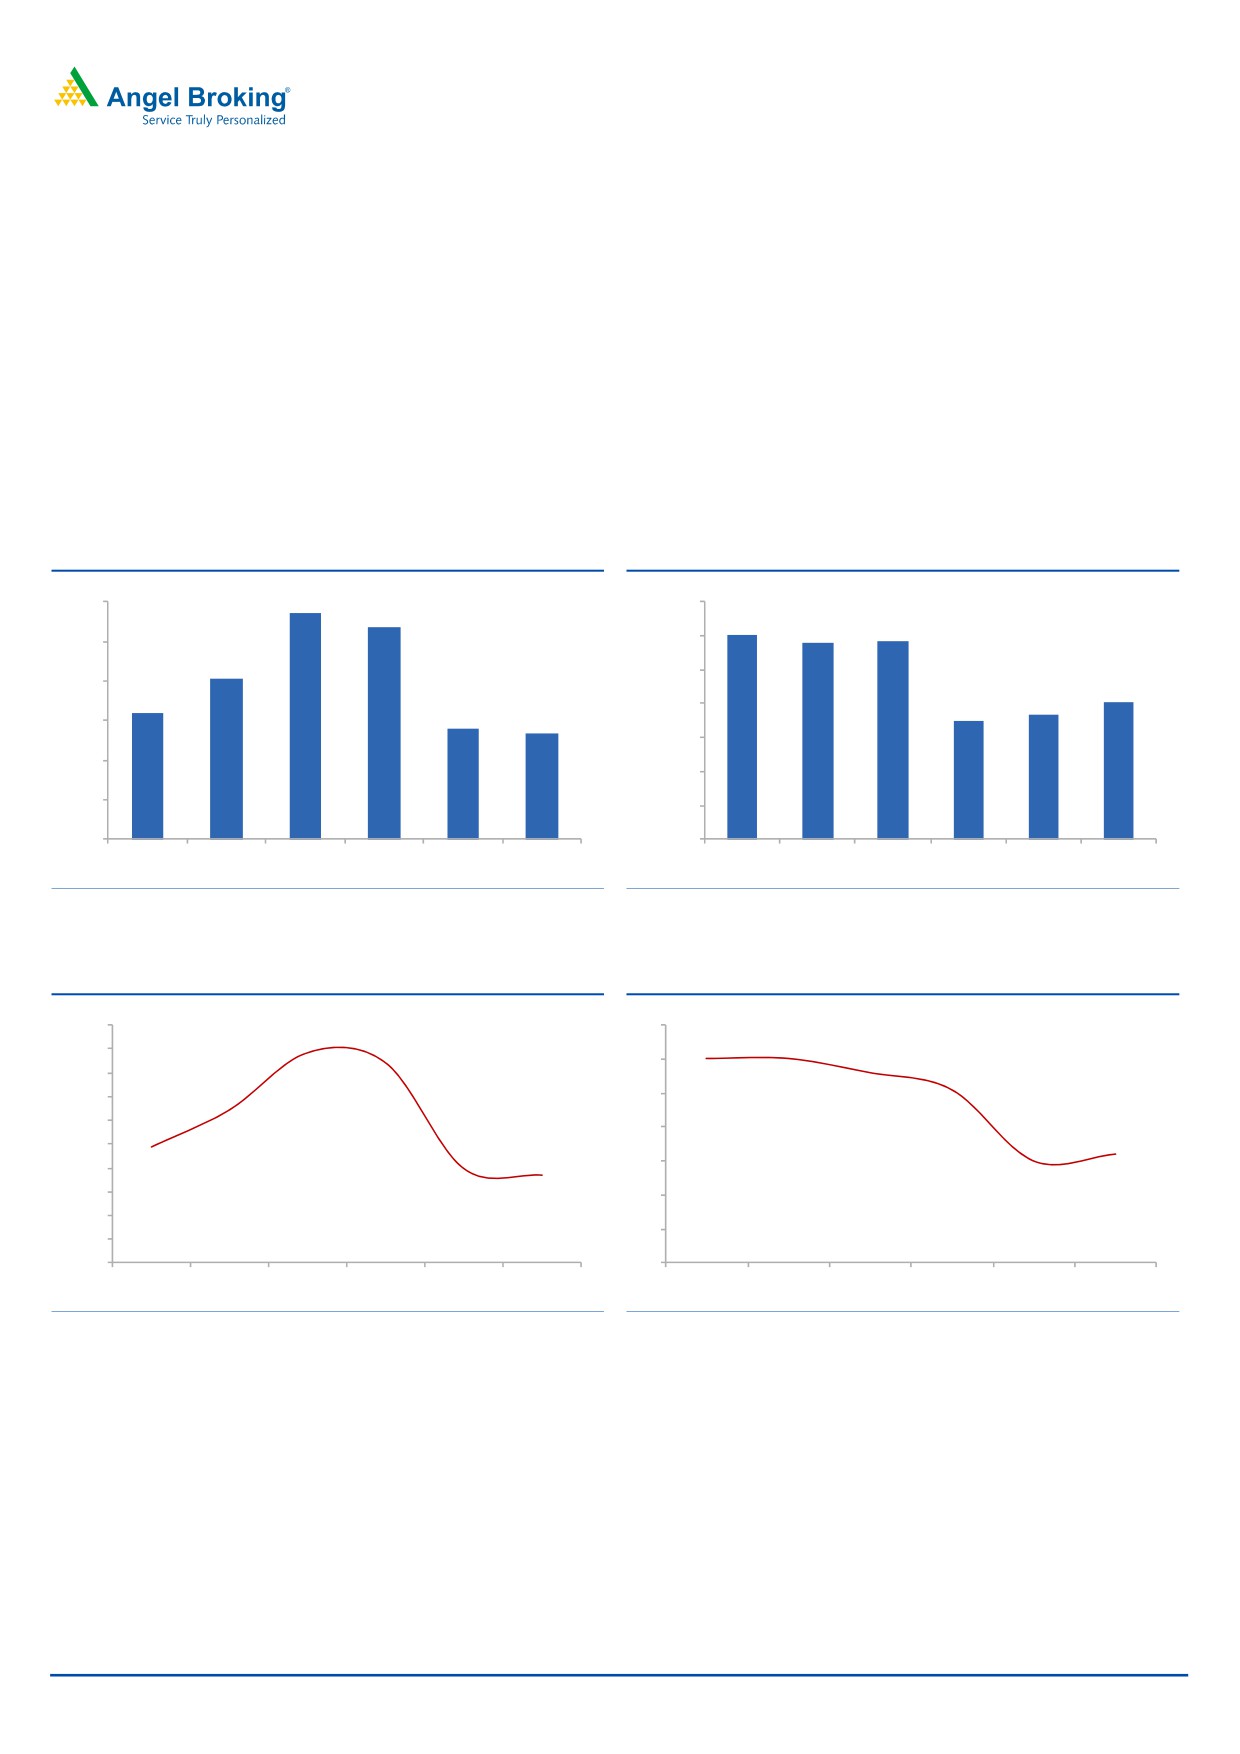
Exhibit 1: Loan Book growth (%)
Exhibit 2: Loan Book Composition (%)
90,000
20.0
18.1
18.1
80,000
17.
0
11
70,000
15.0
13.3
28
60,000
10.0
50,000
40,000
5.0
36
30,000
20,000
-
(1.5)
26
10,000
-
(5.0)
FY14
FY15
FY16
FY17E
FY18E
Retail
SME Corporate
Agri
Advances (` cr)
Growth (%)
Source: Company, Angel Research
Source: Company, Angel Research
Exhibit 3: Loan Composition Trend
Loan Composition (` Cr )
Q1FY16
Q2FY16
Q3FY16
Q4FY16
Q1FY17
Q2FY17
Retail
16,035
16,392
14,265
14,987
15,133
17,795
SME
13,011
13,875
14,033
15,172
15,325
16,235
Corporate
15,130
15,272
16,668
19,652
20,693
22,451
Agri
6,159
6,137
6,062
6,636
6,445
6,700
Total
50,335
51,676
51,028
56,447
57,596
63,181
Loan Composition (%)
Retail
31.9
31.7
28.0
26.6
26.3
28.2
SME
25.8
26.8
27.5
26.9
26.6
25.7
Corporate
30.1
29.6
32.7
34.8
35.9
35.5
Agri
12.2
11.9
11.9
11.8
11.2
10.6
Source: Company, Angel Research
December 1, 2016
2
Federal Bank | Company Update
Deposit growth will get a further boost, CASA to remain
high
The deposit growth for the banking industry witnessed some improvement in
Q2FY17. Federal bank reported a jump of 17% in deposit base on top of 12.5%
growth in Q1FY17. We have already seen rush in bank deposits amid the
demonetization move, this will further accelerate the growth in deposit base.
Though interest rates will further come down, the banking industry including
Federal Bank will continue to see surge in deposits in the months to come.
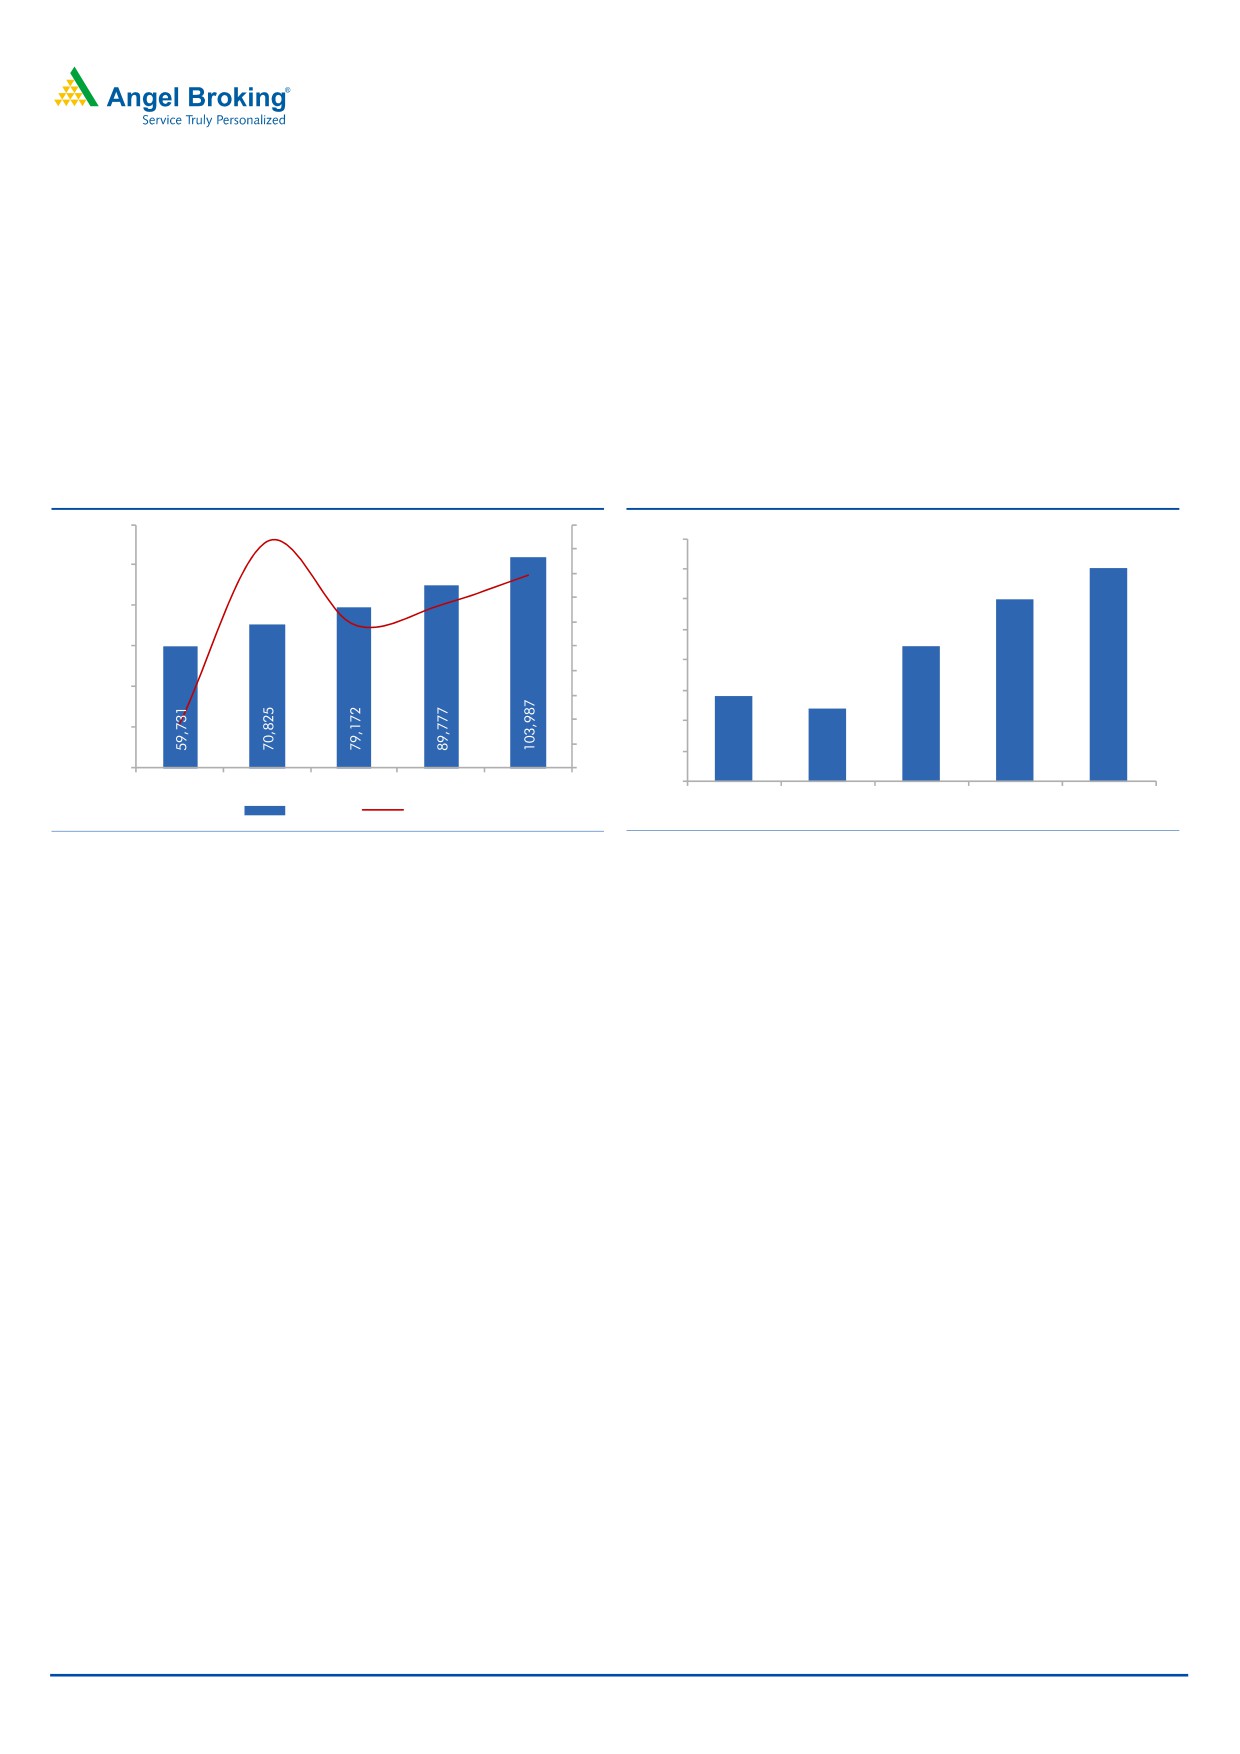
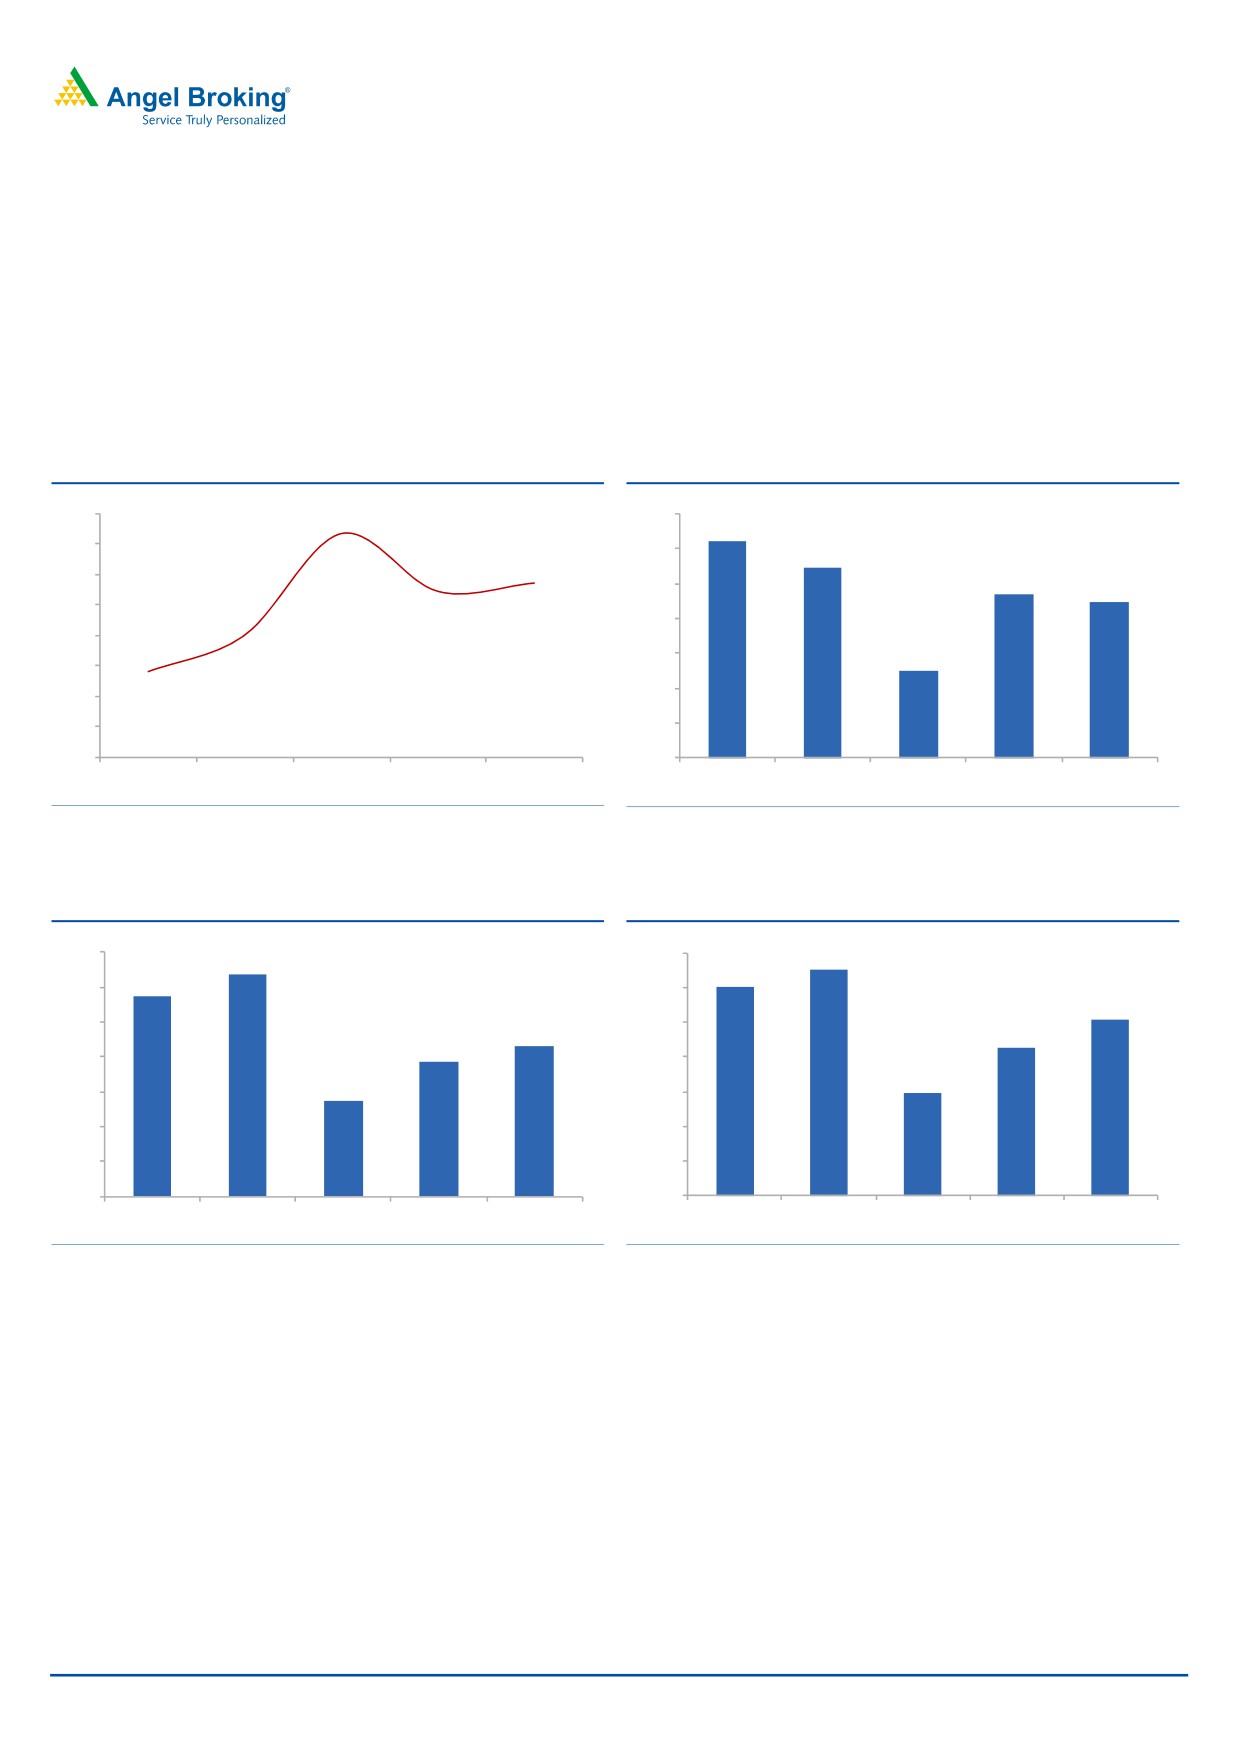
Exhibit 4: Deposit growth trend (` Cr)
Exhibit 5: CASA Ratio (%)
120,000
20
18.6
36.0
18
35.0
100,000
35.0
15.8
16
34.0
14
34.0
80,000
13.4
11.8
12
33.0
32.5
60,000
10
32.0
8
30.8
40,000
31.0
30.4
6
4
30.0
20,000
3.7
2
29.0
-
0
28.0
FY14
FY15
FY16
FY17E
FY18E
FY14
FY15
FY16
FY17E
FY18E
Deposits
Growth (%)
Source: Company, Angel Research
Source: Company, Angel Research
December 1, 2016
3
Federal Bank | Company Update
Asset quality stress has started stabilizing
Slippages had been relatively higher for Federal Bank for all the quarters in FY16.
However in 1Q and 2Q of FY17, the bank delivered meaningful control over
slippages and this was an encouraging sign. In absolute terms, the slippages were
`280cr and `266cr vs. `571cr in Q3FY16 and `536cr in Q4FY16. While it’s too
early to say that the trouble is over, the initial sign has been clear and that is
incrementally there could be lower slippages.
While it is difficult to quantify the impact of demonetization on the industry, SME
segment do have large exposure to the cash form of business either for input or for
the finished goods that they deal with. However, it is safe to assume some
incremental stress on the SME.
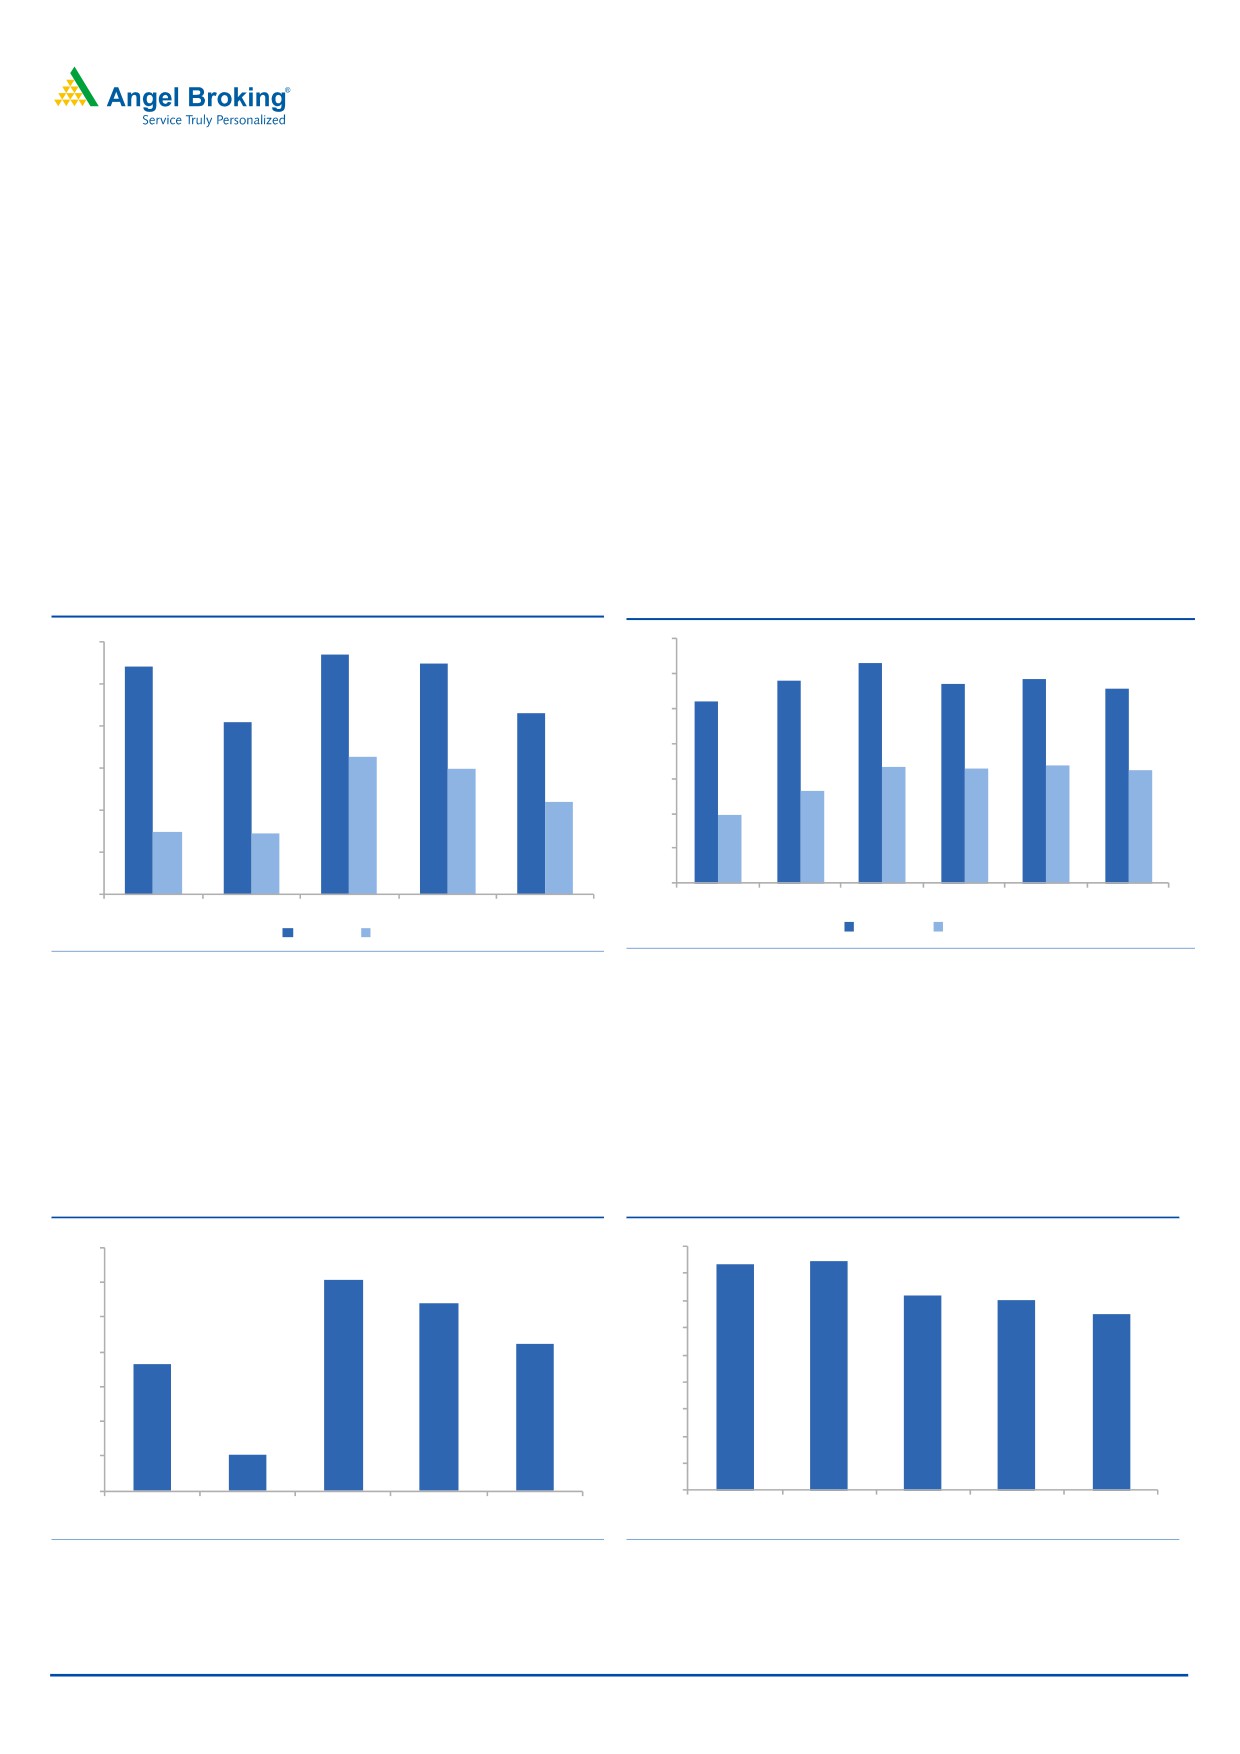
Exhibit 6: GNPAs & NNPAs Ratio yearly trend
Exhibit 7: GNPAs & NNPAs Ratio quarterly trend
3.00
2.84
3.5
2.70
2.73
3.1
2.9
2.8
2.9
3.0
2.8
2.50
2.6
2.15
2.04
2.5
2.00
1.64
2.0
1.49
1.7
1.6
1.7
1.6
1.50
1.3
1.5
1.10
1.0
1.00
0.74
0.73
1.0
0.50
0.5
-
0.00
Q1FY16
Q2FY16
Q3FY16
Q4FY16
Q1FY17
Q2FY17
FY14
FY15
FY16
FY17E
FY18E
GNPAs %
NNPAs %
GNPAs (%) NNPAs (%)
Source: Company, Angel Research;
Source: Company, Angel Research
Credit cost remained elevated for FY16; however, we have started witnessing some
moderation in the same. Accordingly, we expect credit cost top fall to 110bps in
FY17 and further to 80bps in FY18. The bank might take higher provisions in
order to improve its PCR. However, on a like to like basis we don’t expect sharp
rise in provisioning.
Exhibit 8: Credit Cost (%)
Exhibit 9: PCR (%)
1.4
90.0
83.4
84.7
1.2
80.0
72.2
1.2
1.1
70.4
70.0
64.7
1.0
0.8
60.0
0.7
0.8
50.0
0.6
40.0
30.0
0.4
0.2
20.0
0.2
10.0
0.0
0.0
FY14
FY15
FY16
FY17E
FY18E
FY14
FY15
FY16
FY17E
FY18E
Source: Company, Angel Research
Source: Company, Angel Research
December 1, 2016
4
Federal Bank | Company Update
Slippages from SME could see some stress post demonetization,
but improvement in corporate book gives comfort
Federal Bank’s pipeline of accounts with potential stress was relatively lower and
was one of the lowest in recent quarters, when they declared their Q2FY17 results.
The expected slowdown in the economy post demonetization could put some
pressure on the SME loan book. However, we don’t expect material deterioration
in the corporate loan book segment for the bank. While in Q2FY17, the bank
witnessed some incremental restructuring, we don’t expect large accounts to come
forward for restructuring in the near term. Further there are a couple of accounts
which should get upgraded from the restructured book in the quarters to come.
Exhibit 10: Slippages (` Cr)
Exhibit 11: Restructured Loan (` Cr)
571
600
3,500
536
3,018
2,889
2,920
3,000
500
405
2,500
400
2,012
317
1,839
2,000
1,755
280
300
266
1,500
200
1,000
100
500
0
-
Q1FY16
Q2FY16
Q3FY16
Q4FY16
Q1FY17
Q2FY17
Q1FY16
Q2FY16
Q3FY16
Q4FY16
Q1FY17
Q2FY17
Source: Company, Angel Research;
Source: Company, Angel Research
Exhibit 12: Slippages Ratio (%)
Exhibit 13: Restructured Loan (%)
7
5.00
4.42
4.20
6.0
6.0
4.50
5.6
6
4.00
5.1
3.22
3.50
5
3.00
2.44
4
3.2
2.50
1.98
3.0
1.85
3
2.00
1.50
2
1.00
1
0.50
0.00
0
Q1FY16
Q2FY16
Q3FY16
Q4FY16
Q1FY17
Q2FY17
Q1FY16
Q2FY16
Q3FY16
Q4FY16
Q1FY17
Q2FY17
Source: Company, Angel Research;
Source: Company, Angel Research
December 1, 2016
5
Federal Bank | Company Update
High credit cost dented the return ratios so far, expect RoE to
bounce back in FY18:
Higher slippages dented the RoE both due to reversal of interest and rise in
provisions. However, the lower slippages expected in the coming years, would
normalize the return ratios and we expect RoE to scale back to 10% trajectory by
FY18. Further, accelerated loan growth should also support higher fees income
and consequently RoE
Exhibit 14: Cost/ Income (%)
Exhibit 15: NIM Trend (%)
58
56.7
3.1
3.1
56
3.1
3.0
53.5
52.9
54
3.0
3.0
3.0
52
50.0
3.0
50
47.6
2.9
2.9
48
2.9
46
44
2.8
42
2.8
FY14
FY15
FY16
FY17E
FY18E
FY14
FY15
FY16
FY17E
FY18E
Source: Company, Angel Research;
Source: Company, Angel Research
Exhibit 16: ROA (%)
Exhibit 17: ROE (%)
1.4
1.3
14.0
13.0
12.1
1.2
1.2
12.0
10.1
1.0
10.0
0.9
8.5
0.8
0.8
8.0
5.9
0.5
0.6
6.0
0.4
4.0
0.2
2.0
0.0
0.0
FY14
FY15
FY16
FY17E
FY18E
FY14
FY15
FY16
FY17E
FY18E
Source: Company, Angel Research;
Source: Company, Angel Research
December 1, 2016
6
Federal Bank | Company Update
Outlook and valuation
Federal Bank has already recognized large part of the troubled assets as NPAs.
While there could be incrementally some degree of stress on the SME book, we
believe gradually there should be overall improvement in the asset quality, backed
by corporate loan book. Post Q1FY17 results, when the outlook changed towards
asset quality, the stock appreciated sharply; but subsequently has corrected amid
concerns over slowdown and stress on the SME book. At the CMP, the stock is
trading at 1.4x it FY18 Adj BV. We upgrade the stock to BUY with a target price of
`85.
December 1, 2016
7
Federal Bank | Company Update
Income statement (Standalone)
Y/E March (` cr)
FY14
FY15
FY16
FY17E
FY18E
Net Interest Income
2,229
2,380
2,504
2,899
3,292
- YoY Growth (%)
12.9
6.8
5.2
15.8
13.6
Other Income
694
878
786
1,030
1,107
- YoY Growth (%)
4.4
26.6
(10.5)
31.0
7.5
Operating Income
2,922
3,259
3,291
3,929
4,399
- YoY Growth (%)
10.7
11.5
1.0
19.4
12.0
Operating Expenses
1,392
1,631
1,867
2,079
2,352
- YoY Growth (%)
18.0
17.2
14.5
11.4
13.1
Pre - Provision Profit
1,530
1,628
1,424
1,849
2,047
- YoY Growth (%)
4.9
6.4
(12.5)
29.9
10.7
Prov. & Cont.
318
107
704
739
679
- YoY Growth (%)
19.8
(66.5)
559.6
4.9
(8.1)
Profit Before Tax
1,212
1,521
720
1,111
1,368
- YoY Growth (%)
1.5
25.5
(52.7)
54.3
23.2
Prov. for Taxation
373
515
244
365
410
- as a % of PBT
4.9
38.1
(52.6)
49.5
12.5
PAT
839
1,006
476
746
958
- YoY Growth (%)
0.1
19.9
(52.7)
56.8
28.4
Balance sheet (Standalone)
Y/E March (` cr)
FY14
FY15
FY16
FY17E
FY18E
Share Capital
171
171
344
344
344
Reserve & Surplus
6,780
7,567
7,747
8,405
9,123
Net Worth
6,951
7,738
8,091
8,749
9,467
Deposits
59,731
70,825
79,172
89,777
1,03,987
- Growth (%)
3.7
18.6
11.8
13.4
15.8
Borrowings
5,688
2,308
2,177
1,796
3,120
Other Liab. & Prov.
2,224
1,979
1,991
2,461
2,164
Total Liabilities
74,594
82,850
91,430
1,02,782
1,18,738
Cash Balances
3,104
3,380
3,775
4,040
4,679
Bank Balances
1,425
1,400
1,645
1,796
2,080
Investments
24,118
20,569
22,217
23,342
25,997
Advances
43,436
51,285
58,090
68,600
80,253
- Growth (%)
(1)
18
13
18
17
Fixed Assets
425
467
520
515
530
Other Assets
2,086
5,750
5,183
4,489
5,199
Total Assets
74,594
82,850
91,430
1,02,782
1,18,738
- Growth (%)
5.0
11.1
10.4
12.4
15.5
December 1, 2016
8
Federal Bank | Company Update
Ratio analysis (Standalone)
Y/E March
FY14
FY15
FY16
FY17E
FY18E
Profitability ratios (%)
NIMs
3.1
3.0
2.9
3.0
3.0
Cost to Income Ratio
47.6
50.0
56.7
52.9
53.5
RoA
1.2
1.3
0.5
0.8
0.9
RoE
12.1
13.0
5.9
8.5
10.1
B/S ratios (%)
CASA Ratio
30.8
30.4
32.5
34.0
35.0
Credit/Deposit Ratio
72.7
72.4
73.4
76.4
77.2
CAR
15.3
15.5
13.9
13.2
12.4
- Tier I
14.6
14.8
13.4
12.7
11.9
Asset Quality (%)
Gross NPAs
2.70
2.04
2.84
2.73
2.15
Net NPAs
0.74
0.73
1.64
1.49
1.10
Slippages
1.14
1.82
3.62
2.07
1.55
Loan Loss Prov. /Avg. Assets
0.7
0.2
1.2
1.1
0.8
Provision Coverage
83.4
84.7
72.2
70.4
64.7
Per Share Data (`)
EPS
9.8
11.7
2.8
4.3
5.6
BVPS
81.3
90.3
47.1
50.9
55.1
ABVPS
77.5
86.0
41.5
45.2
49.9
DPS
1.0
1.1
0.7
1.1
1.3
Valuation Ratios
PER (x)
7.1
6.0
25.3
16.1
12.6
P/ABVPS (x)
0.9
0.8
1.7
1.5
1.4
Dividend Yield
1.4
1.6
1.0
1.6
1.9
DuPont Analysis
Interest Income
9.5
9.4
8.9
8.5
8.1
Interest Expenses
6.5
6.4
6.0
5.5
5.1
NII
3.1
3.0
2.9
3.0
3.0
Non Interest Income
1.0
1.1
0.9
1.1
1.0
Total Revenues
4.0
4.1
3.8
4.0
4.0
Operating Cost
1.9
2.1
2.1
2.1
2.1
PPP
2.1
2.1
1.6
1.9
1.8
Total Provisions
0.4
0.1
0.8
0.8
0.6
PreTax Profit
1.7
1.9
0.8
1.1
1.2
Tax
0.5
0.7
0.3
0.4
0.4
ROA
1.2
1.3
0.5
0.8
0.9
Leverage
10.5
10.2
10.8
11.1
11.7
RoE (%)
12.1
13.0
5.9
8.5
10.1
December 1, 2016
9
Federal Bank | Company Update
Research Team Tel: 022 - 39357800
DISCLAIMER
Angel Broking Private Limited (hereinafter referred to as “Angel”) is a registered Member of National Stock Exchange of India Limited,
Bombay Stock Exchange Limited and Metropolitan Stock Exchange Limited. It is also registered as a Depository Participant with CDSL
and Portfolio Manager with SEBI. It also has registration with AMFI as a Mutual Fund Distributor. Angel Broking Private Limited is a
registered entity with SEBI for Research Analyst in terms of SEBI (Research Analyst) Regulations, 2014 vide registration number
INH000000164. Angel or its associates has not been debarred/ suspended by SEBI or any other regulatory authority for accessing
/dealing in securities Market. Angel or its associates/analyst has not received any compensation / managed or co-managed public
offering of securities of the company covered by Analyst during the past twelve months.
This document is solely for the personal information of the recipient, and must not be singularly used as the basis of any investment
decision. Nothing in this document should be construed as investment or financial advice. Each recipient of this document should
make such investigations as they deem necessary to arrive at an independent evaluation of an investment in the securities of the
companies referred to in this document (including the merits and risks involved), and should consult their own advisors to determine
the merits and risks of such an investment.
Reports based on technical and derivative analysis center on studying charts of a stock's price movement, outstanding positions and
trading volume, as opposed to focusing on a company's fundamentals and, as such, may not match with a report on a company's
fundamentals. Investors are advised to refer the Fundamental and Technical Research Reports available on our website to evaluate the
contrary view, if any.
The information in this document has been printed on the basis of publicly available information, internal data and other reliable
sources believed to be true, but we do not represent that it is accurate or complete and it should not be relied on as such, as this
document is for general guidance only. Angel Broking Pvt. Limited or any of its affiliates/ group companies shall not be in any way
responsible for any loss or damage that may arise to any person from any inadvertent error in the information contained in this report.
Angel Broking Pvt. Limited has not independently verified all the information contained within this document. Accordingly, we cannot
testify, nor make any representation or warranty, express or implied, to the accuracy, contents or data contained within this document.
While Angel Broking Pvt. Limited endeavors to update on a reasonable basis the information discussed in this material, there may be
regulatory, compliance, or other reasons that prevent us from doing so.
This document is being supplied to you solely for your information, and its contents, information or data may not be reproduced,
redistributed or passed on, directly or indirectly.
Neither Angel Broking Pvt. Limited, nor its directors, employees or affiliates shall be liable for any loss or damage that may arise from
or in connection with the use of this information.
Disclosure of Interest Statement
Fedral Bank
1. Financial interest of research analyst or Angel or his Associate or his relative
No
2. Ownership of 1% or more of the stock by research analyst or Angel or associates or relatives
No
3. Served as an officer, director or employee of the company covered under Research
No
4. Broking relationship with company covered under Research
No
Ratings (Based on expected returns
Buy (> 15%)
Accumulate (5% to 15%)
Neutral (-5 to 5%)
over 12 months investment period):
Reduce (-5% to -15%)
Sell (< -15)
December 1, 2016
10